
June 2026 | The Newsletter

Monthly Stats
Hello and we hope you're doing well! We ran First Look Statistics for May 2026, and the numbers tell an encouraging story for Austin. Sales volume, pending units, and pricing are all moving in the right direction on a year over year basis, and we believe the data now supports what we've suspected for a few months: Austin likely found its bottom in 2025. The broader economic backdrop remains uncertain, with consumer confidence hitting a multi-year low and mortgage rates creeping back up, but Austin's local fundamentals are outperforming the national mood.
Key Highlights:
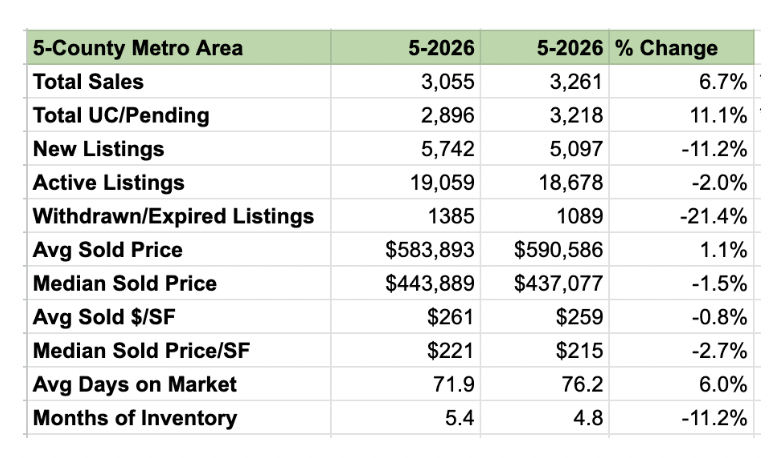
Total sales in the 5-County Metro increased 6.7% year over year to 3,261 closed transactions, and total dollar volume sold rose 7.95% to $1.93 billion for the month.
Total pending/under contract units increased 11.1% year over year to 3,218, which is the strongest leading demand indicator in the dataset and points toward continued strength in June and July closings.
Months of Inventory (MOI) dropped from 5.4 to 4.8 year over year, a decline of 11.2%, pulling the market closer to balanced territory.
Average Sold Price edged up 1.1% year over year to $590,586, while Median Sold Price saw a modest 1.5% decline to $437,077, a much narrower gap than we were seeing throughout 2024 and early 2025.
New Listings decreased 11.2% year over year and Withdrawn/Expired Listings dropped 21.4%, meaning fewer homes are entering the market and even fewer sellers are giving up. That combination tightens supply quietly but meaningfully.
Pricing Stabilizes with Diverging Signals
As you can see in the chart above, Average and Median Sold Prices have been on a gradual recovery trend since bottoming out around January 2026. Average Sold Price is now back near $590,000, roughly in line with where it was in mid-2025 before the late fall dip. Median Sold Price at $437,077 is still slightly below year-ago levels, down 1.5%, but the trend line is heading in the right direction. The divergence between average and median pricing tells us that higher-end homes are recovering faster, while the entry-level and mid-range segments are still working through their correction. That is not unusual at this stage of a cycle, and we expect the median to close that gap over the next two to three quarters.
Pending Units Are Running Well Ahead of 2024 and 2025
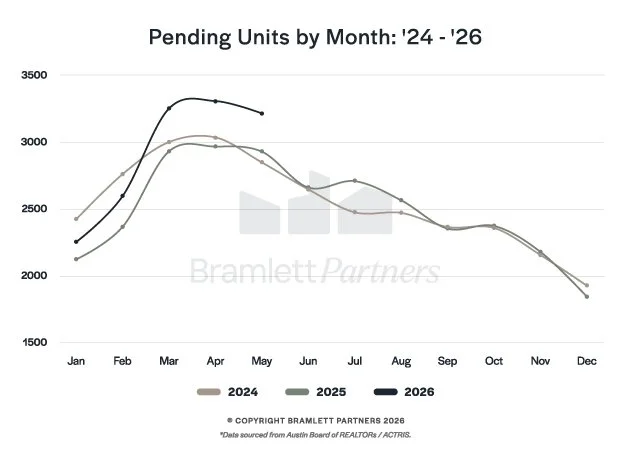
The chart above tells a compelling story. The 2026 pending unit curve peaked in March and April at levels meaningfully above both 2024 and 2025, and May's reading of 3,218 is still running well ahead of those prior years at the same point in time. Pending units are the clearest leading indicator we track because they represent actual buyer decisions, not just listings or sentiment surveys. Buyers are out there. They are making offers. That activity will translate into closed sales over the next 30 to 60 days, which bodes well for the summer numbers. The slope of the May decline looks similar to prior years, meaning we are not seeing a demand cliff, just normal seasonal cooling from the spring peak.
Volume Sold Confirms the Recovery Narrative
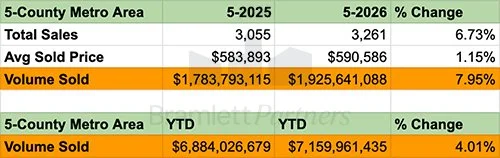
Total dollar volume sold for May came in at $1.93 billion, up nearly 8% year over year. Year-to-date volume through May is now $7.16 billion versus $6.88 billion through the same period last year, a 4% improvement. These are not explosive growth numbers, but they are consistent and broad-based, which is exactly what a healthy market recovery looks like. We are not seeing a few luxury sales distort the figures. The gains are showing up across unit counts, price per square foot, and total volume simultaneously. That coherence matters.
Mortgage Rates and Consumer Confidence Are the Wild Cards
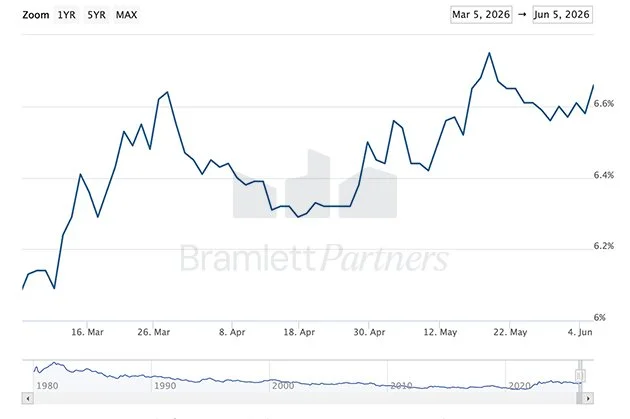

As you can see in the charts above, the national picture is not as clean as Austin's local data. The University of Michigan Consumer Confidence Index dropped sharply to 44.8 in May, well below the consensus estimate of 48.2 and down meaningfully from February's recent high near 56. That is a concerning reading. Consumer confidence at those levels has historically correlated with pullbacks in big-ticket purchases, including homes. Separately, mortgage rates have crept back up to approximately 6.6% after dipping earlier in the spring, reversing some of the affordability progress we saw earlier in the year. Neither of these trends is catastrophic, but they are headwinds worth watching. Austin's market is outperforming national sentiment right now, and the question is how long that divergence can hold if rates stay elevated and consumer confidence does not recover.
If you're a buyer
This is a real window. Inventory remains elevated relative to the pandemic years, seller motivation is real, and you are buying at prices that are still well below the 2022 peak. Rates at 6.6% are not ideal, but the buy-now-refinance-later calculus still applies if the purchase makes sense for your life. Waiting for rates to drop while inventory tightens and prices recover is a risk in this market.
If you're a seller
The data supports a more optimistic posture than we would have said six months ago. Demand is up, inventory is contracting, and volume is growing. That said, this is not 2021. Pricing correctly from the start still matters enormously. Overpriced listings are sitting, and the buyers who are active are well-informed and not chasing. Price it right, present it well, and the market will respond.
Always remember that real estate is hyperlocal and hypersituational. If we can help you with your home/property or if you would like to strategize your situation, please reach out.